
Here at Slickstream, we have two top priorities that guide everything we do:
- Creating a better user experience for your website's visitors
- Increasing the actual engagement on your site
The first point is easy to see, and our feedback from happy customers speaks for itself. But measuring increased engagement is a little trickier, which is why we were so happy when our friends at Pinch of Yum volunteered to open up their site for some thorough testing.
Well the results are in, and we're absolutely thrilled. We'll dive into the details below, but here's the short version: in one week of analysis, our Engagement Suite increased total clicks 17.6%, led to 489 additional hours of on-site activity, and raised pageviews and revenue 2.2%!
Let's dive into the details below.
The Basics
The structure was a pretty simple A/B test. For a full week we randomly split Pinch of Yum visitors into two categories: one group saw Slickstream's search, discovery and engagement tools on Pinch of Yum, and the other group didn't. That's it.
We then measured the behavior of all ~750,000 visitors during that period (all anonymized, of course), and analyzed the difference.
And just as an aside for my fellow stats geeks out there: all of the following metrics are statistically significant at a 95% confidence level, and are expressed either per session or as the extrapolated difference in a full week of traffic to each group. But you don't have to know what that means to keep reading, I promise.
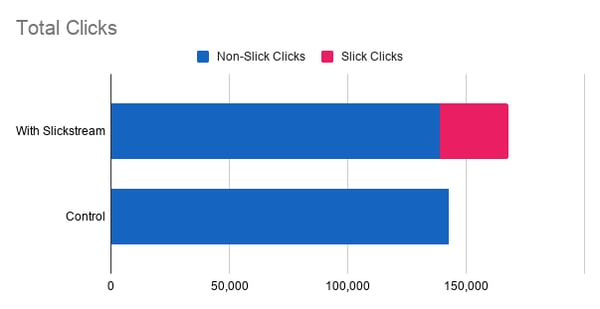
Clicks
Clicks refer exclusively to when visitors use a hyperlink to go to another page. They don't include interactions with favorites, scrolling, or tapping on the search tool.
This was the metric we were most excited to track, because it's the one we knew we could impact the most. After all, directing visitors to more of your pages is what we do!
But even with our high expectations, the results blew us away. The Slickstream group clicked on 17.6% more content than the control group.
One thing we were worried about is 'cannibalization', or the idea that Slick Clicks would just replace clicks that users would have made anyway. And while we did detect a slight impact there (about 2.8% fewer users clicked non-Slickstream links), we generated more than 7x as many clicks as we lost. How's that for a good trade?
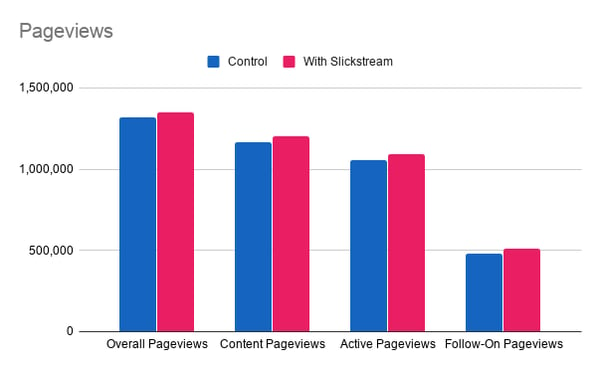
Pageviews
Pageviews are the number of times visitors viewed any page on your site. This includes the first page they land on, browser refreshes, and just about every other time they see your content.
So now you may be asking, what did all those clicks lead to? The answer is about 30,000 extra pageviews.
That's right, using Slickstream generated 30k more pageviews for Pinch of Yum in a single week. For a site that earns $16 RPM, that would be worth nearly $500 in additional revenue.
Here's how that impact looks as a portion of Pinch of Yum's traffic:
- Overall pageviews: + 2.2%
- Content pageviews (only recipe pages): + 3.0%
- Active pageviews (visitor engages on a page): + 3.2%
- Follow-on pageviews (everything after visitors arrive on site): + 6.1%
That's not bad for a tool that's easy for anyone to set up without any tech help, and is built to load extremely fast (barely registering a blip on Google's page speed test).
User Activity
Slickstream measures user activity in 10-second increments where a visitor does something (scrolling, tapping, clicking, etc.) on a page.
Obviously pageviews are crucially important for most publishers, as they're in many ways directly tied to revenue. But we've actually found that activity on a page more accurately reflects how much money it will generate, so we include activity as a key part of our Engagement Suite analytics.
In this case, activity on Pinch of Yum went up 2.7% with Slickstream, translating to 489 additional hours of on-site activity over the course of a full week.
Search
We love our fast and responsive search tool, and firmly believe it creates a best-in-class user experience for websites. Sadly though, we weren't able to measure its impact over the course of this test simply due to sample size limitations. We'll have more data about search soon enough — stay tuned!
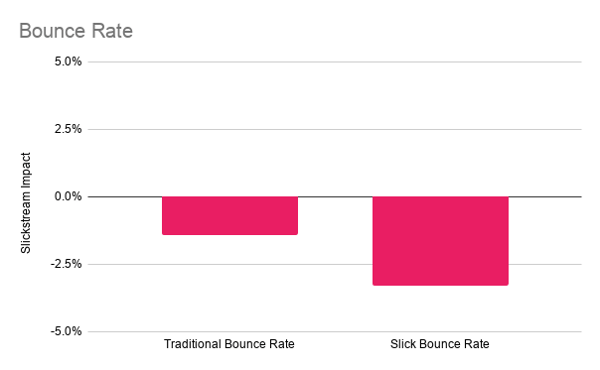
Bounce Rate
Bounce rate refers to the percent of users who view only one page before leaving your site.
Another impact of increasing engagement on a site is lowering its bounce rate. So for Pinch of Yum, all those additional clicks and pageviews translated to a 1.4% decrease in the number of people who only saw one page.
But bounce rate only tells part of the story. After all, sometimes a good user experience only takes one page! That's why we created 'Slick Bounces', a metric which only includes users who *don't engage at at all*. By including our engagement tools on their site, Pinch of Yum decreased Slick Bounces by 3.3%, an even greater impact on (what we feel) is a more important statistic.
The Verdict
We'll let Bjork Ostrom from Pinch of Yum take it from here:
"Successful creators know that building a blog requires a unique balance between two things:
1. Creating a website that "feels" good when people consume the content (user experience)
2. Once people are there, getting people to actually consume that content (engagement).
It's art. But it's also science.
Slickstream does an incredible job combining these two things into one product, and the impact it's had for Pinch of Yum has been significant."
There you have it.
Just for total transparency, Bjork and Lindsay were early adopters of Slickstream, and Bjork serves as an advisor to the company. We like to think that's continued proof he's still a fan, but it's also probably part of why he was so accommodating with this test.