The success of our publishers is the most important thing for us at Slickstream. When they're happy, we're happy, and that's the principle that drives all of our decisions on the Engagement Suite (and everything we do).
But to understand how we can improve, it's important we understand exactly the impact we're currently having. To that end, we periodically do voluntary A/B testing with certain high-traffic sites, which allows us to isolate our net effect over time (see our Case Study with Pinch of Yum).
Most recently, Dr. Urvashi Pitre from TwoSleevers.com was kind enough to share the results from her recent Slickstream test. The findings are really exciting, and we'll dive in below!
But first: For those unfamiliar with A/B testing, it's actually quite simple. We split a site's audience into two groups: One that sees Slickstream on site, and one that doesn't. From there we can measure the performance of each group over a set period of time (in most cases one week is plenty) and see the difference in a variety of important metrics. We calculate the data both internally and with our Google Analytics integration, which lets users verify the results for themselves.
Now with that primer out of the way, let's get to the stats.
On TwoSleevers.com, over a full week of data, Slickstream outperformed the control group in every measured metric by a statistically significant margin. Here are the net effects, as measured in Google Analytics:
- Overall pageviews rose 2.6%
- This was largely from pageviews per session (+1.9%)
- But it also was due in part to an increase in sessions per user (+0.6%)
- Session duration climbed by 10.6%
- Bounce rate decreased by 1.3% (percentage points)
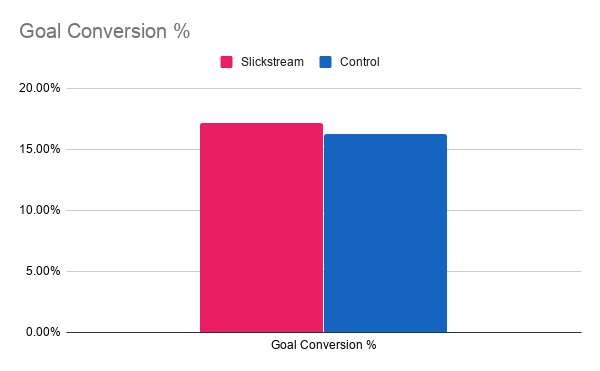
- Perhaps most excitingly, goal conversions saw a 5.5% boost
Conversions
We've talked about our impact on pageviews, session duration, and bounce rate in the past (see again: Pinch of Yum Case Study), and these results fall very much in line with our previous findings. But being able to see the goal conversion data is new.
In TwoSleevers' case, the goal in question was a commonly used template in Google Analytics: Share / Social Connect. It's an engagement goal measuring when a post has been shared via email or social media.
Because we were able to tell Google which users did and didn't see Slickstream, Urvashi's chosen goal was actually measurable as part of the test. And as it turns out, the results were better than we anticipated: the group using Slickstream was 5.5% more likely to share the content.
This, of course, is not universally applicable to all goals. But what it does show is that the benefits of a more engaged audience are not limited to pageviews alone. Enabling visitors to better find the content they're looking for has positive follow-on effects on a variety of key metrics, and these effects compound over time.
Compounding Effect
"These effects compound over time." So what does that mean, exactly?
The short answer is that Slickstream's effect is not just limited to individual sessions, but is in fact more powerful the longer the Engagement Suite stays on your site.
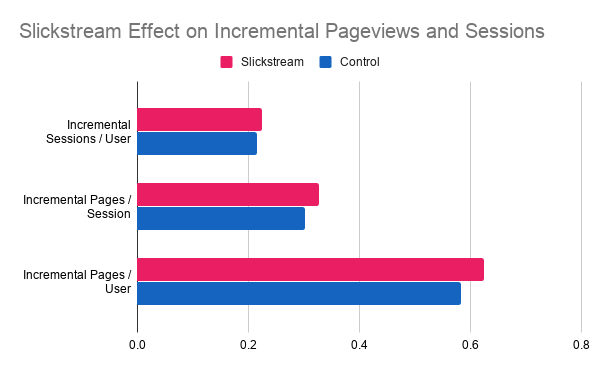
In the case of TwoSleevers, an individual session resulted in about 1.9% more pageviews when Slickstream was on the site. But we also found that over the course of the week of testing, the likelihood of a second session rose as well.
In all, users were about 0.6% more likely to return to TwoSleevers a second time during the week if their first session included Slickstream. The effect may seem relatively small, but it's statistically significant and grows over time.

Above, you can see the impact that Slickstream had on incremental pageviews and sessions. That is to say: If you remove the minimum one pageview and one session per user, this shows how much they engaged with and without Slickstream.
From the chart above, it's easy to see how the two separate effects (on pages/session and sessions/user) combine to form the even greater effect on total pages/user over the duration of the test.
A Parting Note
We love getting new chances to test Slickstream on our users' sites, and it's always encouraging to see when we're making a difference. While A/B testing is available to our users, we will never share any data or findings without your explicit permission.
So with that in mind, we want to sincerely thank Dr. Pitre for allowing us to write up this study and giving us access to her metrics in Google Analytics. It should be noted that she is a data scientist who runs her own marketing agency, so her endorsement means a lot to us!
If you're a Slickstream customer and are interested in a test, or want us to write up a case study on your experience with the Engagement Suite, let us know! Just shoot us an email or use our contact form and we'll get back to you as soon as we can.