
Slickstream's Journey Explorer is a tool for website publishers who are seeking to better understand how visitors are using their site. Many existing services enable a publisher to measure trends and summarize usage. Journey Explorer is, by contrast, designed to let you see the details about visits, one at a time.
This feature is currently included as a part of the Slickstream Engagement Suite.
How It Works
Slickstream is a cloud service. When you sign in and add your website, we create a portal for you. When you authorize us to access your Google Analytics, we start a process of periodically fetching data about events on your site. When you add Slickstream's embed code to your website, this allows us to monitor visitors to your site without affecting their experience.
This data is stored securely in our servers and is never shared without your explicit permission. We reprocess this data into "journeys". Each journey is a complete record of every action taken by one visitor to your website. A journey may be as simple as a single visit to a webpage. Or it may involve dozens of visits in which many different types of actions and events are identified (searches, clicks, form submissions, goal completions, etc.)
These journeys are maintained in a database so that when you go to your Journeys page in your Slickstream portal, you'll be able to find and review journeys of interest to you. We maintain a history of journeys. The amount of time that they are kept varies based on how interesting a given journey is. A single-page visit with no follow-up might get discarded quite quickly to make room for other journeys that have more pageviews containing many features.
We tag each journey and each pageview within a journey based on "features" we find. A feature represents some aspect that may warrant your attention. For example, if a visitor did a search on your site during one of their pageviews, that pageview (and the overall journey) will be tagged with the "search" feature. In the explorer, you can then easily find all of the recent journeys in which the visitor performed at least one search. There are many different features which you'll learn about later.
Getting Started
It is easy to get started.
If you are an Engagement Suite user interested in trying journeys, please reach out to us directly for more information.
And if you don't yet have a Slickstream account, the process will be as follows:
- Sign in, creating an account if you don't already have one
- Add your website, providing your site's URL
- Provide access to visitor data
- Start exploring journeys
Once you have started the process, Slickstream will continue monitoring visitor data and you can return anytime to review journeys. Depending on your settings, we will also send you notifications via email when we spot interesting journeys that we think you'll want to review.
Data Sources
Slickstream currently supports two different ways to provide visitor data needed to assemble journeys: Google Analytics (GA) and Slickstream Embed. You may want to get started first with GA, but we strongly recommend new users add Slickstream Embed as soon as possible. We do the best job when you provide both, because although Slickstream Embed provides more data, we can combine this with other information, such as goals and e-commerce data that is available only from GA.
Google Analytics
If you monitor traffic on your website using GA, then the easiest way to get started with Journeys is to authorize Slickstream to access your GA data. This is very easy. Just click the Authorize button in the Google Analytics section of the Site Dashboard page in your Slickstream portal. This will redirect you to Google where you confirm your choice, and then you'll be back to Slickstream. Once there, we will show you a list of web properties that you have access to in GA, and you'll select the one that you want us to monitor.
GA limits what data we are able to access, and how much we are able to get each day. Because of GA quotas and restrictions, we are able to fetch information from GA for about 1000 visitors per day. If you have a low-traffic site, that may cover all of your traffic. But more likely, that means that we will be sampling. We do that sampling in a smart way, so that this is not a purely random selection among your visitors, but is carefully balanced between high-engagement and lower-engagement visitors so that you will see a good mix.
GA can only provide the data to us that your site is providing to them. So the details about a given journey will be limited if you are only using GA as your data source. For example, with GA, you cannot see how much time a visitor is spending reading your content during a pageview. You can't see when they submit forms. You can't see how much advertising revenue is being generated. And so on. But if you have configured GA with things like goals, or if your site is sending extra events to GA beyond the pageview event, then we can include that information in the journey we record. For that reason, we recommend that even if you add Slickstream Embed to your website, you should also link us to your GA as well. We are able to consolidate information from both sources into the same journeys.
Slickstream Embed
Slickstream Embed is something that you add to your website that allows us to monitor activity by visitors to your site. It collects data in a way that is similar to GA -- in that it operates from within the visitor's browser and it sends data to Slickstream in the cloud during each pageview. Like GA, we have little or no impact on the performance or visitor experience. So there is no risk adding Slickstream Embed to your site.
Slickstream Embed is a few lines of javascript that are added to the <head> of your webpages. It is very easy to add it into your website. For WordPress sites, you can use Slickstream's plugin. For most other CMS's there are simple instructions for how to add a script tag into all of your pages. If you use Google Tag Manager (GTM), you can use it to add Slickstream as well.
Slickstream Embed is the preferred way for us to collect visitor data, since we are able to monitor all aspects of visitor journeys. And because we are not limited by GA quota and API restrictions, we are able to assemble journeys for every visitor. However, as mentioned above, we still recommend that even if you add Slickstream to your website, you should also link us to your GA account so that we can pull out additional metadata from there (such as goal completions, etc.)
Adding Slickstream to your website also makes it possible to try Slickstream's Engagement Suite features including world-class site search, personalized content recommendations, favorites, membership, and more. If you are interested in that, please reach out directly.
Dashboard Page
You can visit your portal anytime at https://portal.slickstream.com. Select your website and you should land on your site's Dashboard page. On this page, you'll be able to add, remove, and review the data sources that we are using. You'll see the status of each integration and can update them if needed.
Journey
A journey is a record of all of the actions and experiences of one particular visitor to your website over all time.
Let's consider this example of a journey:
- A month ago, a visitor from Madison, Wisconsin on their desktop machine came from Google to your home page. They spent 30 seconds reading.
- They clicked through to your Contact page and signed up for your newsletter, providing their email address.
- A week later, in response to your newsletter email campaign, they returned to the landing page you used and they spent 2 minutes reading that.
- They then visited 3 more pages and left.
- Yesterday, they returned directly to your home page again. They searched on your site for "pricing".
- On your pricing page, they spent 3 minutes reading.
- Then they navigated to 2 of your recent posts and engaged with one of them.
This is one journey that spans many pageviews in many sessions over many days. It includes everything we can tell you about this one visitor. If you review this journey next week, it may have more to it by then.
Visitors and IDs
We talk about a "visitor" but to be more precise, a journey represents all of the activity from a particular user on a particular browser on a particular device. If the same person comes to your website using a different browser, then we will treat that as a different visitor. If the local storage for a browser is discarded, then this will also mean that this same person will appear to us as a different visitor and therefore we may show you two different journeys.
The thing that uniquely identifies a journey is an identifier that depends on how the data was collected. If our data source is Google Analytics, then a visitor is identified by the combination of Google's propertyID and clientID. If our data source is Slickstream Embed, then it maintains its own unique readerID. However, Slickstream Embed also records the propertyID and clientID, if any, within the browser context. So when you use both data sources, we are able to use this to merge these data together into a single journey. If cookies and/or local storage on a browser is deleted, then new identifiers will be created for both data sources and that will result in a new journey for future events from that browser.
Journey Details
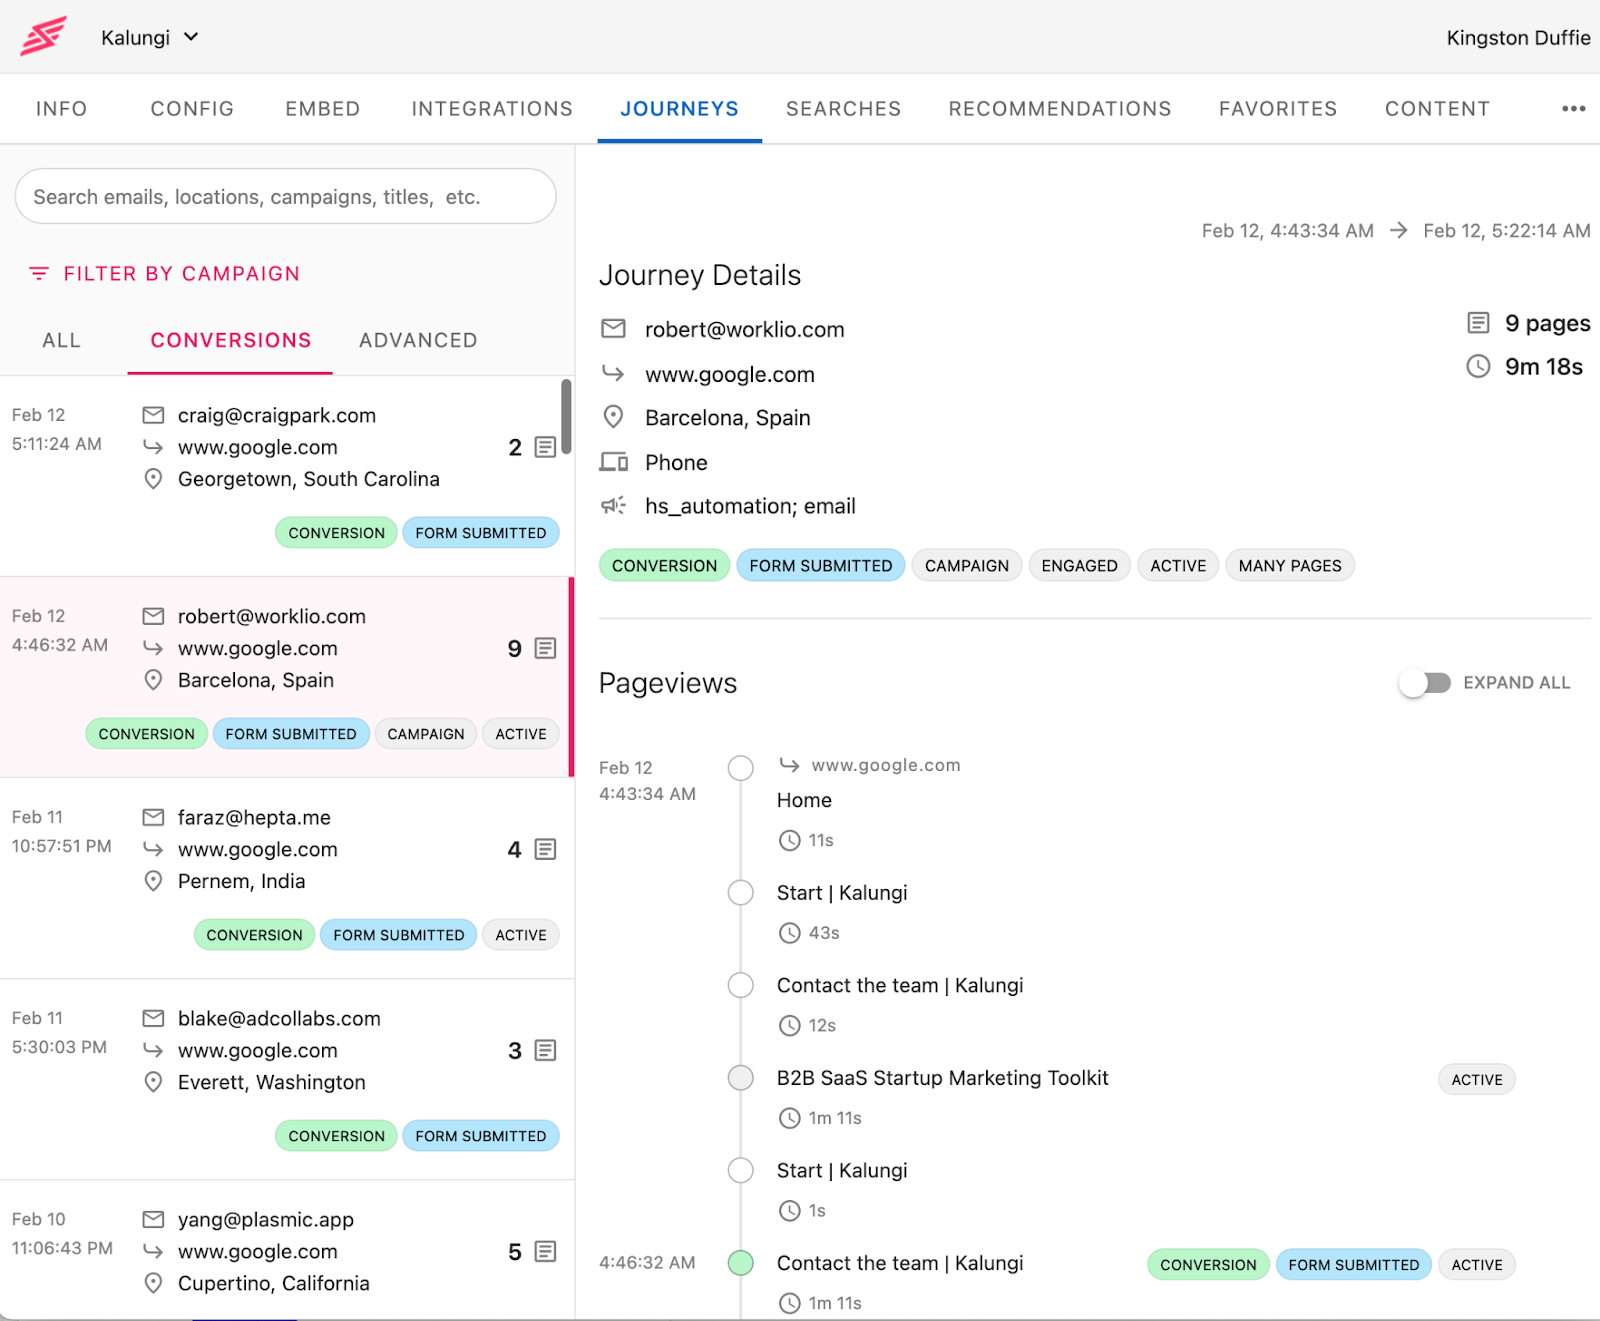
In the Journey Explorer, you will see details for a selected journey. Here's an example of what that might look like:
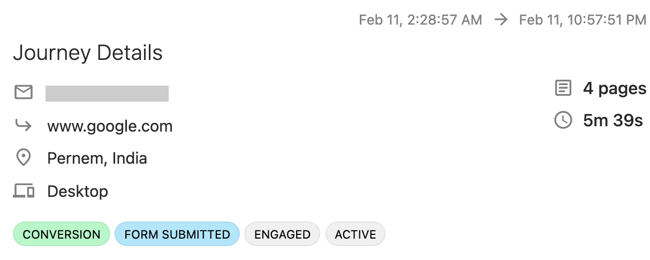
At the top is a card that summarizes the journey, including key values and metrics about it.
In the top-right corner, you'll see a date range. This tells you when the journey started and the time of the last event we witnessed in that journey. If we see new events in future for this visitor then this same journey will be extended accordingly.
Next you'll see several values summarizing what we know about the journey:
- Email: If we were ever able to identify the visitor's email address during the journey, that will be displayed here. This is done using Slickstream Embed via form submission monitoring and/or memberships.
- Source: This is the original referrer domain for this visitor, if any
- Location: For privacy reasons, we do not store the IP address of the visitor, but we do use it to identify the location of that visitor, if possible
- Device: Based on the user agent of the browser, we identify the type of device being used: desktop, phone, or tablet
- Campaign: Based on UTM codes, this tells you the campaign(s) that brought this visitor to your site. Note that a single journey may involve multiple campaigns, such as when a visitor comes to your site multiple times in response to different ads or emails.
- Pages: The page count tells you the number of different pages on your site that have been visited during the entire journey. If the same page is visited several times, that only counts for 1 here.
- Activity: If you are using Slickstream Embed, then we are able to track the amount of time a visitor spends engaged with your content -- not just the total time on the page. If you spend 10 seconds reading a page, then go and get a cup of coffee and return, that counts for only 10 seconds of activity. This is the sum of all active engagement over the whole journey.
-
Revenue: If you use advertising on your site and use standard header bidding, then Slickstream Embed is able to monitor auctions occurring during each pageview and will report the sum of all winning bids for ad slots on your pages. This is the sum of all winning bids during all pageviews during the journey.
At the bottom of the journey card, you'll see an array of feature tags. These summarize for you the notable features of the journey so that you can quickly spot journeys with particular characteristics. See Journey Features for more details.
Pageviews
Below the summary card, you will see a table of pageviews for the journey. All events in a journey happen within the context of a pageview. If you are familiar with Google Analytics, you might be wondering what happened to "sessions". In reality, a session is a simply a collection of pageviews that happen to be near to one another in time. Google's definition of a session is arbitrary. A new session starts whenever there has been a gap of at least 30 minutes between pageviews, or when a new pageview is on a different day (in the local timezone) from the previous pageview. We have therefore concluded that sessions do not add any meaning to a journey and ignore them. In the table of pageviews, each one has a timestamp that tells you exactly when it occurred. If you are interested in session boundaries, the rules above will tell you where they occur.
Before digging into the details of pageviews, it is important for you to understand that consecutive pageviews in a journey do not imply any causality. Pageviews are ordered chronologically. But when you consider browser actions (BACK, FORWARD, REFRESH) and CMD-CLICK behaviors, and multi-tab browsers, you'll quickly understand that the order of pageviews does not imply by any means that each one resulted from a click on a hyperlink in the previous one.
Let's look at one pageview in a journey.

In its normal collapsed state, the pageview tells you:
- timestamp: The timestamp when the pageview started. If this is on a different date than the previous pageview, it will include the date as well as time.
- timeline: The vertical timeline shows a bubble for this pageview. If the pageview has notable features, then the bubble will be filled with the color associated with the most important of these features -- a conversion in this example.
- title: The title of the page on which the pageview occurred
- url: When you hover (or tap) on the title, you'll see a callout icon to its right. Clicking on this will open the same URL that was recorded for this pageview.
- activity: Below the title is shown the total activity time spent by the visitor during this pageview. If there was no engagement at all, this will be blank.
- features: To the right you may see one or more colored bubbles that identify the notable features associated with this particular pageview. Note that we do not necessarily list all features -- only the notable ones. For example, if the same feature (like "events") occurs on a high fraction of pageviews, we may omit it. To learn more, see Journey Features.
If you are interested in even more detail about a pageview, tap on it to expand it. Or click on the Expand All button in the top-right.
Here is an example of an expanded pageview:
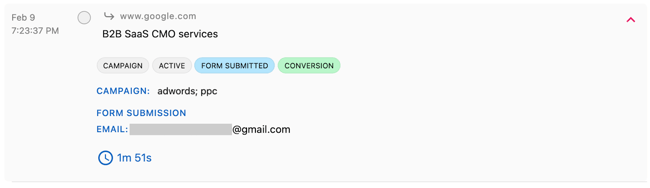
In addition to the other information, you may see details about some of the features. In this case, you are seeing the campaign that led to this pageview and the details entered into a form on this page.
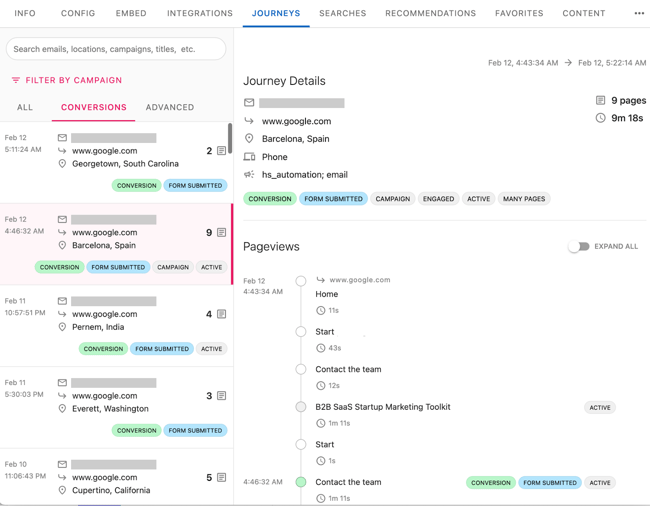
Explorer
On the Journeys page in your Slickstream portal, you'll find the journey explorer. Here is an example of what it might look like:
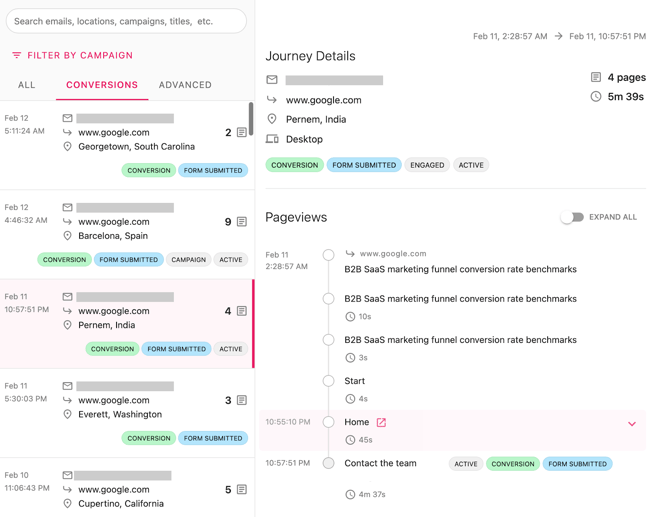
On the right side of the page you will see a journey, with the summary card at the top and the timeline of pageviews below it -- as described in the Journey section.
On the left side of the page you see the explorer. This is a list of recent journeys on your site.
There are three tabs: All, Conversions, and Advanced.
All Journeys
On the All Journeys tab, you will see a list of all recent journeys recorded on your website in reverse chronological order based on the timestamp of the last pageview in that journey.
When using Slickstream Embed, these journeys are processed in near-real time, with approximately a 15 minute delay. If you are only using Google Analytics data, then we are able to fetch data only once per day and information is sampled, so the most recent data will be from yesterday and you may be seeing only a subset of the actual journeys.
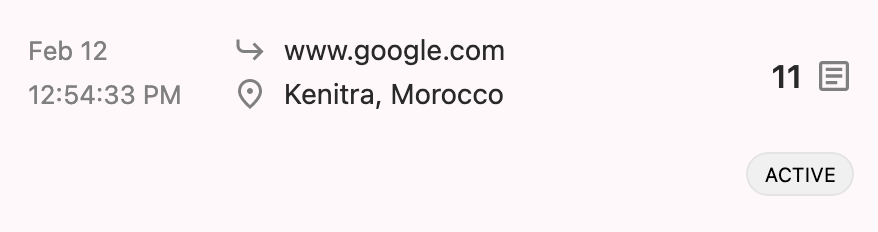
Each card in the list represents one journey and shows you a condensed summary of that journey. For example, this card tells you about a journey that had its most recent pageview at 12:54:33 PM which includes pageviews from 11 distinct pages and in which the user has engaged (based on the "active" feature).
Tapping on one of the cards in the journey list will select that journey and show it to you on the right side of the page.
Conversions
Different kinds of publishers think about conversions in different ways: MQLs, newsletter signups, purchasers, etc. Learn more about how we support conversions. Because these visitors are of greater interest than others, we have a tab in the explorer to list only those journeys where a conversion has occurred.
If you tap on the Conversions tab, you will see a list of recent conversions -- i.e., journeys in which a conversion occurred. These are sorted in reverse chronological order of the conversion (not of the last pageview in the journey). On this tab, the timestamp tells you when the conversion occurred (rather than the last time we saw this visitor).
The feature bubbles on each card will typically give you useful information about the conversion. For example, you'll see the "conversion" feature. It will usually be paired with another feature that led to that conversion, such as a form submission or a goal completion or a key-page visited, depending on your settings.
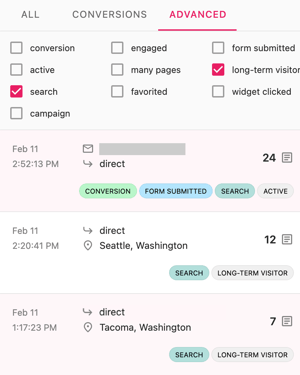
Advanced
The Advanced tab helps with finding a subset of recent journeys that have a specific feature or set of features. There is a set of checkboxes of all of the features that appear at least once among your recent journeys. Check the ones that you are interested in.
For example, here you can see that "long-term visitor" and "search" have been checked and there are 3 journeys that share those features. Then you can tap on one of those to see the journey in detail.
Campaign Filter
For many creators, campaigns are used to drive traffic to your website. Campaigns can be anything from advertising to email marketing to affiliate links. Learn more about how we support campaigns.
While exploring journeys, on any of the tabs (all, conversions, or advanced) you can apply a filter so that you will only find journeys that are associated with a particular campaign. To do this, tap on button that says, "Filter By Campaign" just above the tabs. This will open a dialog listing all of the different campaigns that we have detected among your recent journeys. Select the one of interest and click on Save. Here's what that dialog might look like:
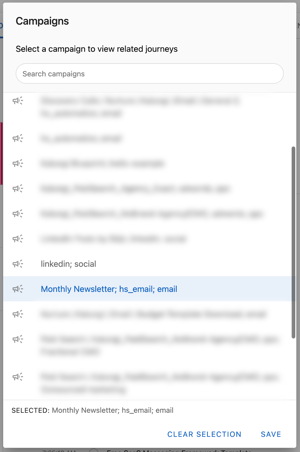
Having selected that filter, all of the journeys listed will have an association with that campaign. Note that a single journey may be associated with multiple campaigns. For example, you may have arrived initially because of a Google AdWords campaign, but then returned again later in response to an email campaign. When you add a campaign filter, you find all of the journeys that include that campaign anywhere among their list of campaigns.
Search
Above the campaign filter is a search box. If you type in this box, the other filters and tabs disappear. We will list journeys that match the search query. We include many aspects of a journey when searching in this way. For example, you could type the name of the state that the visitor comes from. Or you could type all or part of the title of a page that the person visited. (You can also paste in the URL of a page of interest.) Or you could type the name of a feature that you are interested in.
The results will change as you type your search query. To return to the original explorer layout, just clear the search box.
Journey Features
If you think of all of the visitors to your website as a forest, then each visitor is like a tree. We think it is very valuable to look at the detailed journey of one visitor at a time. However, in a forest, there are a lot of trees, and some are a lot more interesting to look at than others. In the same way, if you have to look at all visitors one at a time, you probably won't be rewarded.
To address this, we tag each journey (and, in fact, each pageview within a journey) with a list of "features". In the tree analogy, think of these features as general characteristics of the tree like, "tall", "bushy", "large-diameter", "hardwood", "leafy", etc. Now you can say that you'd like to see examples of tall hardwood trees and not be distracted by all of the others.
For journeys, we define characteristics that may be interesting to distinguish. We may add others in the future. Here is a list of the current features:
Engaged: This applies to pageviews and implies that the visitor engaged, at least briefly, with the page -- such as scrolling or clicking.
Campaign: This implies that this pageview resulted from a campaign -- typically because the URL associated with the pageview carries UTM codes.
Search: This means that the visitor has used the site's search ability to find something on the site.
Form submitted: This means that we were able to see the visitor submitting a form on the site. (We ignore form submissions unless they contain certain identification-related information.)
Key page: You can designate certain pages on your site (by URL) as "key pages". A pageview to one of these pages adds this feature.
Goal: If you configure Google Analytics with goals, and that goal is completed in this journey, then this feature is added.
Ecommerce: If your site reports e-commerce events to Google Analytics then this will cause this feature to be added accordingly.
Event: If your site reports customer events to Google Analytics then this feature will be added.
Active: If the amount of activity on a pageview exceeds a certain threshold, then we will add this feature to the pageview.
Many pages: If the number of unique pages visited during the journey exceeds a certain threshold, then this feature is added.
Widget clicked: If using Slickstream's Engagement Suite, and one of its widgets is used during the pageview to navigate to another page on the site, then this feature is added.
Conversion: If a conversion occurs, this feature is added. For more information, see Conversions.
Long-term visitor: If the time between the first and last pageview in a journey exceeds a certain threshold, this feature is added to the journey.
Favorited: If using Slickstream's Engagement Suite and the visitor sets a page as a favorite, this feature is added to that pageview.
Member: If using Slickstream's Engagement Suite and the visitor signs up as a member, this feature is added.
High revenue: If the site uses advertising and uses header bidding for auctions, we will add this feature if the total value of winning bids is above a certain threshold and among the top 2% of pageviews in terms of revenue.
Conversions
Most publishers are very interested in "conversions" -- i.e., visitors who, in some way, represent a greater opportunity to the publisher. For businesses, you might call these "marketing qualified leads" or MQLs. For bloggers, these may be your loyal visitors -- those people who sign up for your newsletter or become members. For e-commerce sites, these may be those who make a purchase. The definition of a conversion is up to you. We provide you with the flexibility of determining what constitutes a conversion.
We typically think of a conversion as the point in time when a visitor's identity becomes known. However that need not be the case. You might decide that if someone comes to your website and arrives on your "contact us" page, you want to count that as a conversion. Or you might use a sign-up system that is outside of our ability to monitor, but after signing up, you will send that visitor to a "thank you" page. So the arrival on that thank-you page is a signal that this journey involves a conversion.
Journeys with conversions are usually among the most interesting to look at. You can see how their journey evolved until they converted. And you can see what they did after they converted.
A sales person, for example, might find it very valuable to see what a new lead did on the website in order to decide how best to make a pitch to this lead. That sales person could go to the Journey Explorer, type the email address of the lead into the search box, and see what their journey looked like.
A journey to be marked as a conversion for a number of reasons.
Form Submissions
If you use Slickstream Embed on your site, then we are able to monitor most types of form submissions. We can see what the user entered into the form. And if that includes typical identity information, we will add the "form submitted" feature to the pageview and the journey. If the identity information includes an email address, then we will add that email address to the journey (unless it is already populated) and will mark the journey as a conversion.
There is nothing for you to configure to use form submissions as a way to identify conversions.
Note that some sites uses non-standard forms that we may not be able to monitor. One example is when a form is inside an <iframe> on the page -- such as certain forms from third-party providers such as Calendly. We are looking for ways in which we can handle these special cases. Please let us know if you have special requirements like that.
Goals
It is common for publishers to configure Google Analytics with one or more goals. If a visitor completes that goal, then GA will add an event accordingly, and we will add the "goal" feature to the journey.
Some of these goal completion might correspond to a conversion. But it is impossible for us to know, a priori, which goals these might be. So if you have defined one or more goals that you would like for us to treat as a conversion, then in your settings, list these goals (by name) and we will automatically add a conversion when we see one of those goal completions in the journey.
Key Pages
A common way to identify a conversion is to see that a visitor has arrived on a certain page on the website. That page might be, for example, a thank-you page (following a signup) or a checkout page on an e-commerce site. For those that already identify these as goals in GA, you may not need to do anything. But if you prefer, you can also list key pages (by URL) in your Slickstream settings and we will add the "key page" feature to the corresponding pageviews. And if you configure certain pages (again, by URL) as conversion pages, we will add the conversion feature as well.
Membership
If you use Slickstream Embed, we may be able to identify a visitor in other ways. For example, if you use WordPress and someone has signed into your website using WordPress, we may be able to identify them. If your site uses Slickstream Engagement Suite features, it includes membership features that can also identify visitors. In cases like these, if we are able to identify the visitor, we will add the "slickstream membership" feature and set the journey as a conversion.
Campaigns
Much of the world of online marketing is built around the model of "campaigns". A campaign is any means by which you drive visitors to your website. Common examples include online advertising, email marketing, social media marketing, among others.
We use the UTM standard for identifying campaigns. These are parameters added to a URL that identify the associated campaign. You can read more about those here.
On each pageview, we look for UTM parameters to see if the visitor is likely arriving because of a campaign. If so, we add the "campaign" feature and campaign information to that pageview and journey.
We keep track of unique combinations of UTM parameters and assign each one an ID in our system. This allows us to list all of the campaigns we've seen among your journeys and to let you filter journeys based on certain campaigns.
The naming of campaigns is typically up to you. For example, if you create an email marketing campaign using Mailchimp, you can assign the name of that campaign and Mailchimp will add appropriate UTM parameters into all of the links in the emails that are sent. Likewise, when you create a Google AdWords campaign, you can provide a name for that campaign and Google will add it into the hyperlinks that appear inside the ads. You can do this yourself, too. If you send someone an email containing a URL, you can simply make up your own UTM parameters to use and that will make that one email a campaign!
In the Journey Explorer, you'll see that there is a Campaign filter. Tap on that to select one of your campaigns to focus on. This is a powerful tool to understand the behavior of visitors coming as a result of a particular campaign. It may be helpful to look at the overall statistics in GA comparing different campaigns. But it is also powerful to see how specific individuals behaved when coming to your site from a campaign.
Settings
The Settings page in your Slickstream portal allows you to control how you want journeys to work for your site. These include, but are not limited to:
- Do you want to receive email notifications?
- What are the key pages on your website?
- Which of these should be considered conversion?
- Which GA goals, if completed, should be treated as a conversion?
- Which GA events are just noise and should not be included in the journey?
Visit the Settings pages in your portal for details about each available setting.
Conclusion
Journey Explorer is a tool to help publishers to get to know their website visitors better. There are myriad ways in which it can be helpful:
- Sales people can learn about a specific lead to understand if and how they have engaged on the website;
- Marketing people can study how their new campaign is working by looking at how individuals arriving via that campaign are behaving;
- Those spending ad dollars can see how well those ads are performing. For example, it is surprising how often a visitor arrives via a paid click only after first visiting the site. Often the same journey costs the publisher for multiple CPC clicks!
- Content developers can see what visitors to a certain page do after they leave, or where they came from.
- Publishers can study journeys with high engagement but without conversion -- looking for hints about how to get certain visits to convert.
We'd love to hear about your experience using Journey Explorer and suggestions you might have for how to make it more useful.