
One of the best things about Slickstream is the wealth of data available in your analytics portal. It features content insights, clickthrough data, search queries, recommendation pairs, individual widget usage, and more. This article explains how to use Slickstream data to improve your content strategy and develop loyal readers.
Access Slickstream Data
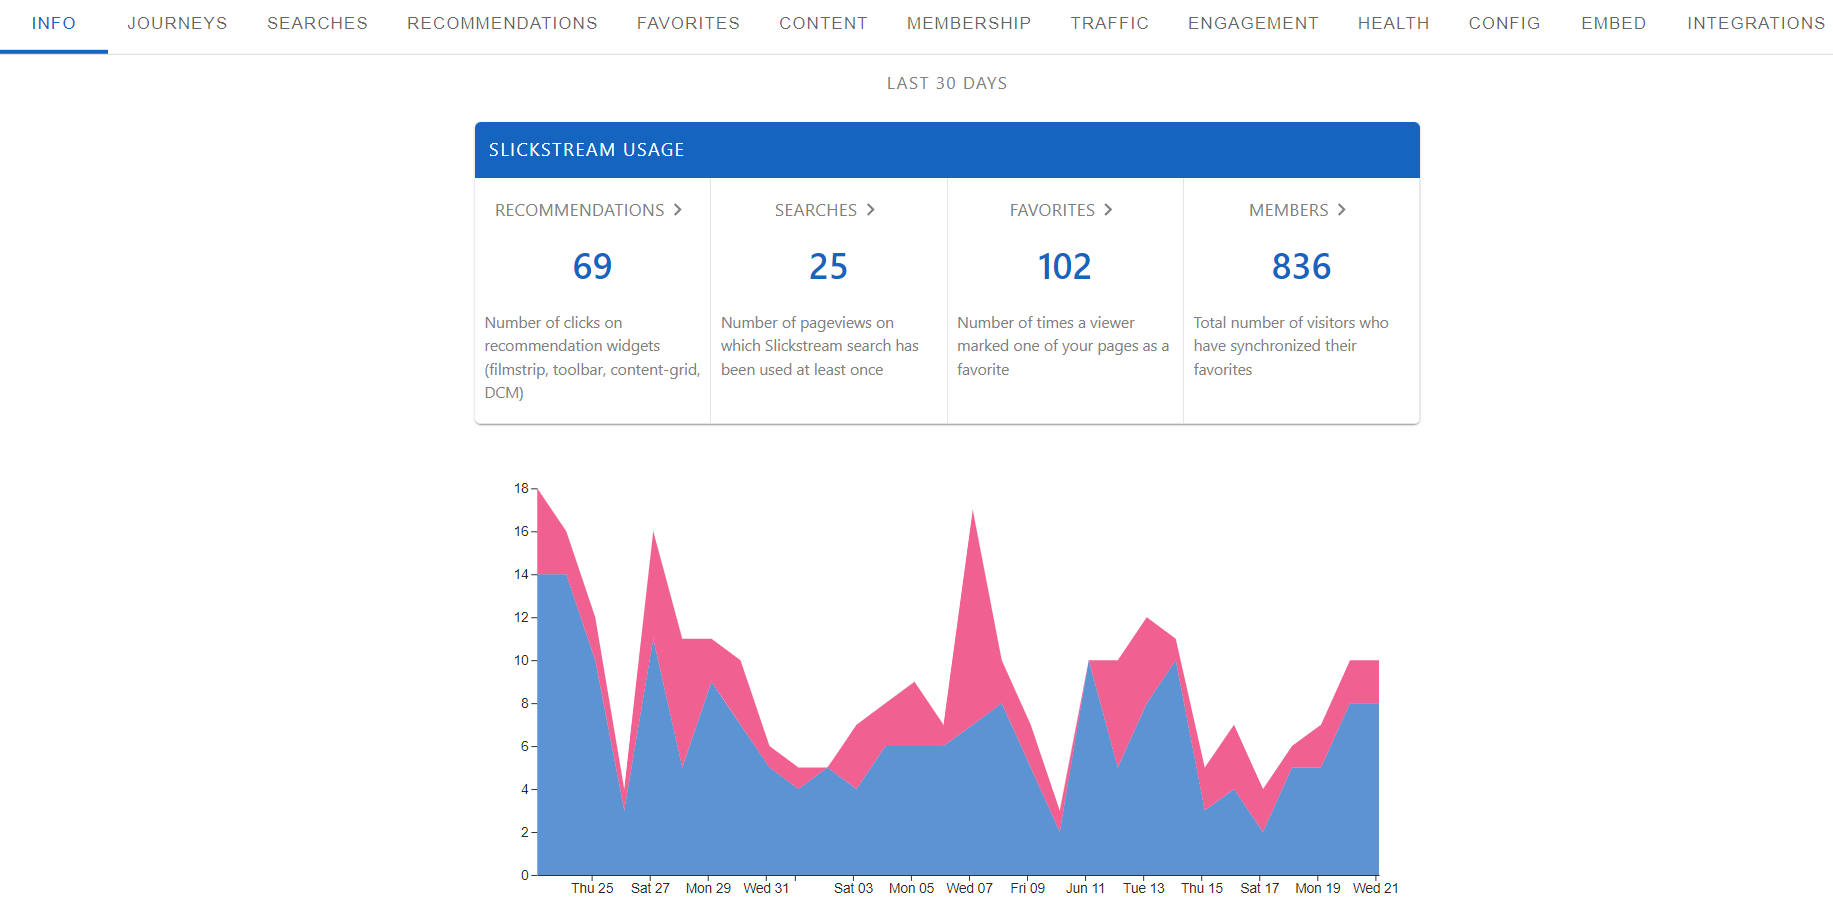
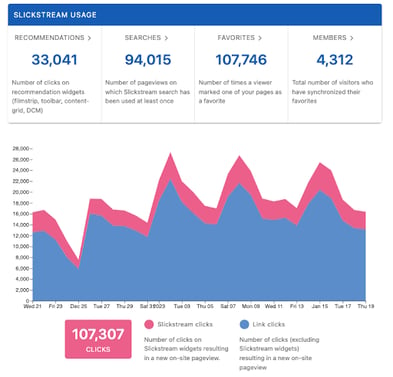
After creating your Slickstream account, you gain access to the portal. On the portal's homepage, you will find a snapshot of feature performance for the last 30 days and summary data on traffic, engagement, and each widget. At the top of the page is a menu to access the different portal analytics.
Slickstream Analytics
Reader Journeys: Understand how users navigate your site
From the portal menu, go to the ‘Journeys’ tab. This page displays each visitor's actions and experiences over time. See acquisition data from each session, active time browsing every page, form submissions, site searches, and more.

Tips
- Identify the topics and content types that drive the most conversions and expand those areas.
- Discover how many readers convert from first-time site visitors to engaged readers and what content they read. Use these insights to inform your content strategy.
- Find out which campaigns generate the most traffic by looking at the pageviews associated with UTM codes. Repeat these high-performing campaigns at a later date.
- Check out the Journey Explorer User Guide for more information on reader journey data.
Searches: See what visitors look for on your site
From the portal menu, go to the ‘Searches’ tab. This page displays how visitors use the search panel to find content on your site. It lists your site's top searches and posts clicked on from search.

Tips
- Use these insights and ensure that the posts visitors click on align with the search topics. Content that precisely matches what visitors are seeking keeps them on your site longer.
- Pair this data with your SEO keywords to understand if the search terms used to find your content are also what they want more of once they arrive.
Recommendations: Find out which posts readers click on next
From the portal menu, go to the Recommendations tab. This page displays the connections between content and tracks the number of readers who moved from one post to another.

Tips
- Identify the best opportunities for content clusters, which are groups of closely related posts around a specific theme. Well-rounded content clusters can lead to lower bounce rates and more multipage sessions.
- Find the topics visitors click on next and create more related content.
- Identify and promote the top content pairs via social media and other channels.
Content: Get into page performance details
From the portal menu, go to the ‘Content’ tab. This page displays all of the indexed pages on your site and how each has been performing for the last 30 days. See what pages readers are most active on, the most favorited, the most viewed, and more.

Tips
- Identify posts with high engagement and promote them via social media and other channels.
- Create additional content for subject areas covered in your most popular posts.
- Update old posts that have lower engagement (e.g., pageviews, active time, favorites)
- See this article for information on the data in this report: Content Report Columns Explained
Memberships: Track and view new subscribers
From the portal menu, go to the ‘Memberships’ tab. This page displays the total number of subscribers and the number of new subscribers in the last 30 days. See the email addresses you can integrate with your mailing list and the number of favorites for each contact.

Tips
- Integrate your email service provider and automatically import new subscribers.
- Ask your subscribers via email to self-segment by asking them a question or requesting that they click on an option that applies to them. Use this segmentation to inform your content strategy or develop an email marketing campaign.
- Customize your membership invitation message to suit your brand and audience. Within the Slickstream Portal, go to Config > Site-Wide > Membership > Sign-up Message.
There are endless ways to take advantage of Slickstream data. Check out this article for more ideas on how to put it to work for you. If you have any questions, please don't hesitate to contact us at support@slickstream.com.
